

// 32 apps
Everything I've built to run on data.
Tableau data apps, data stories and a few toys. Each one opens in your browser.
For Tableau admins
Built on the refresh, usage and activity data a site already keeps.
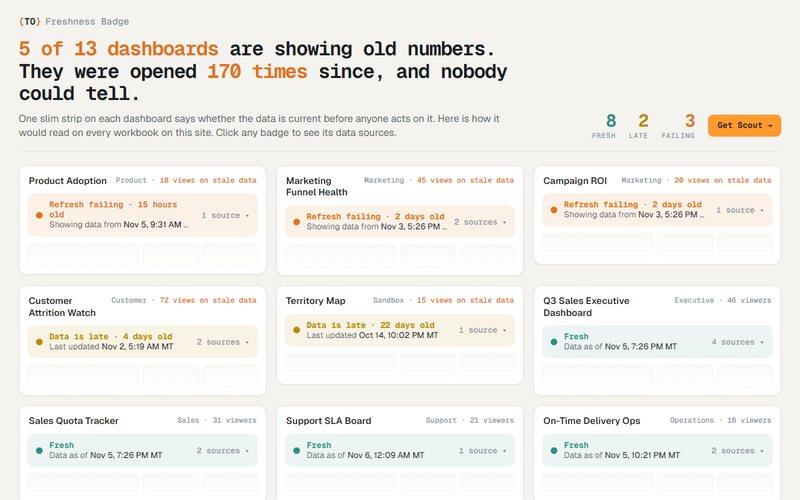
Tells every viewer how old the numbers are, right on the dashboard.
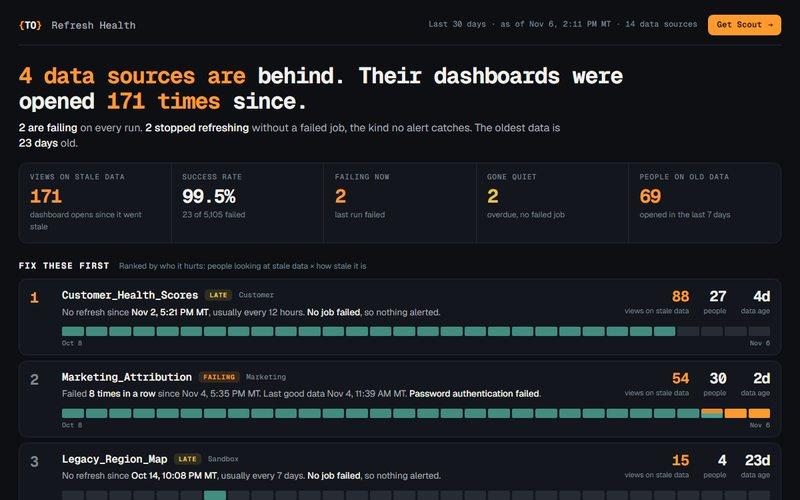
Which data sources are behind, and which dashboards people are still opening on them.
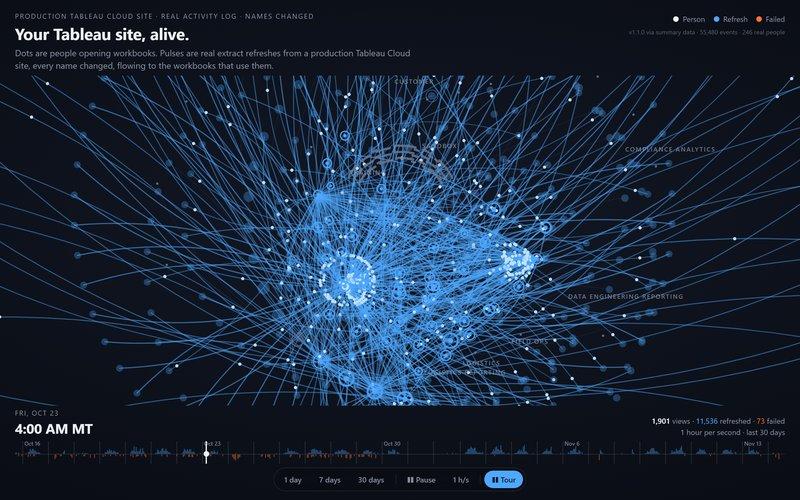
A real production site's views and refreshes as a live network, every name changed.
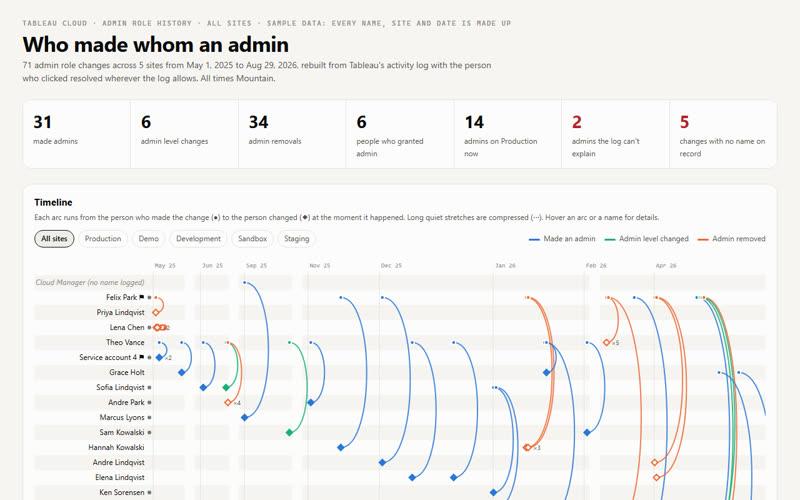
Who made whom a site admin, rebuilt from the activity log. Sample data: every name and site is made up.
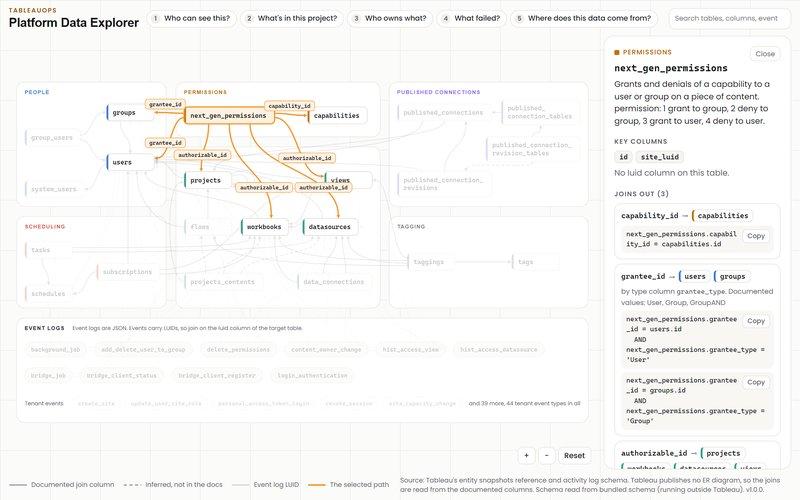
A map of Tableau Cloud's Platform Data API: all 22 entity snapshot tables, the columns that join them and the event logs that point at them.
Data stories
One story each, told from real data. These are web pages, not data apps.
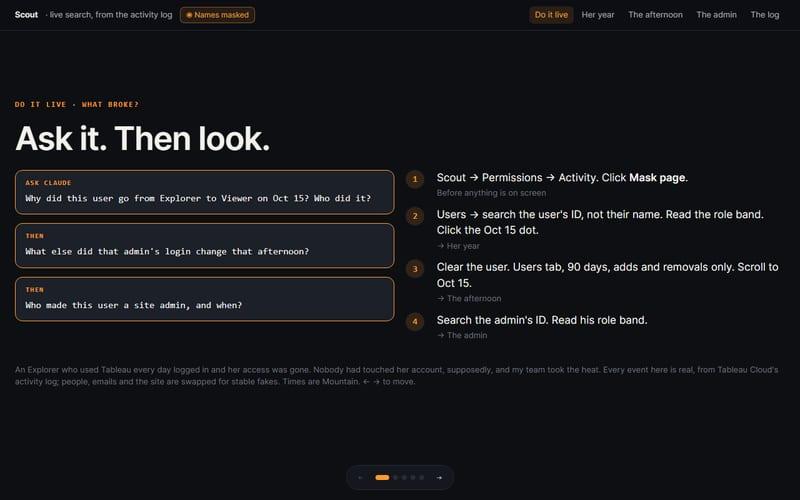
An Explorer lost her access and the log said nobody did it. Five steps through a real Tableau Cloud activity log, names masked, to the "add user" click that did.

My LinkedIn climb from February 2024 to now, one pixel per post: a layoff, daily posts, a new role and two years as a Tableau Ambassador.
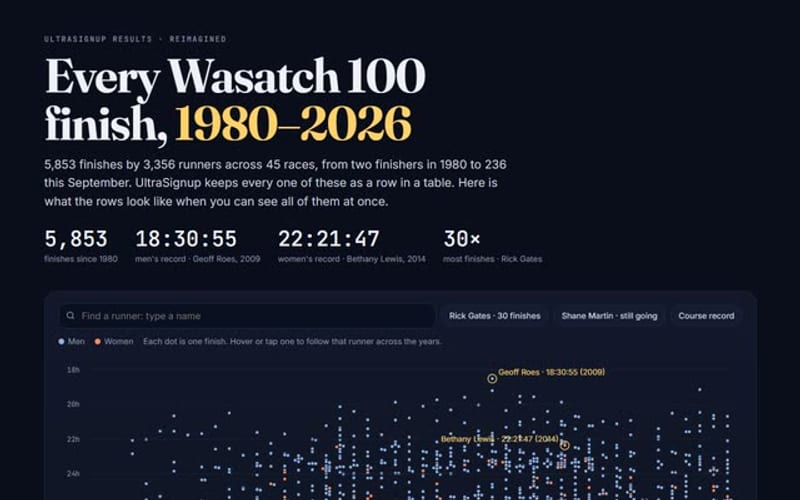
Forty-five years of Wasatch 100 finishes from UltraSignup's public results: every finisher, every career, and the 2026 night shift.
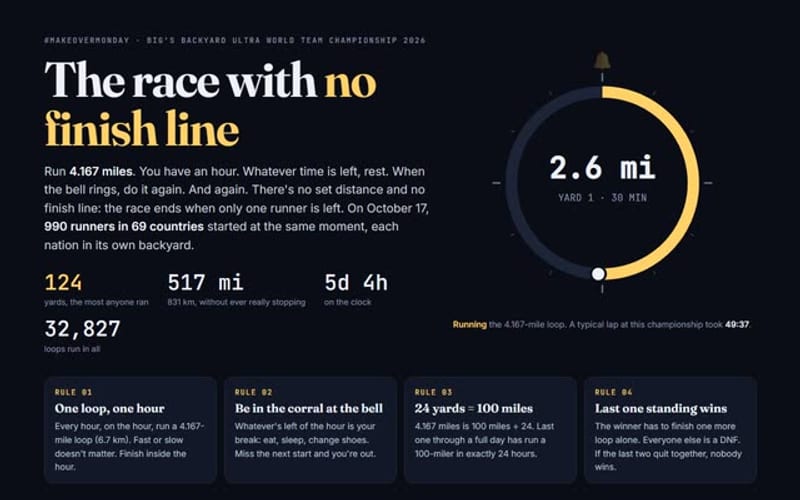
A Makeover Monday: Big's Backyard Ultra World Team Championship explained for newcomers, with every lap of 990 runners from 69 nations.
Superstore, reimagined
Tableau's Sample Superstore, as far from a bar chart as it goes.
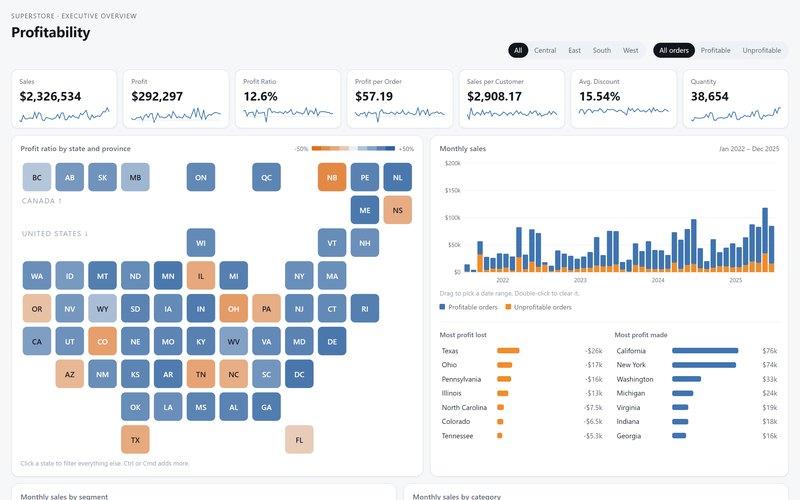
Tableau's whole Superstore sample workbook migrated to one data app, all nine tabs: Overview with targets, Product, Customers, Shipping, Performance vs target, the Commission Model, Order Details, Forecast and What If Forecast. Same numbers to the cent, every calculation in the app.
Download .twbx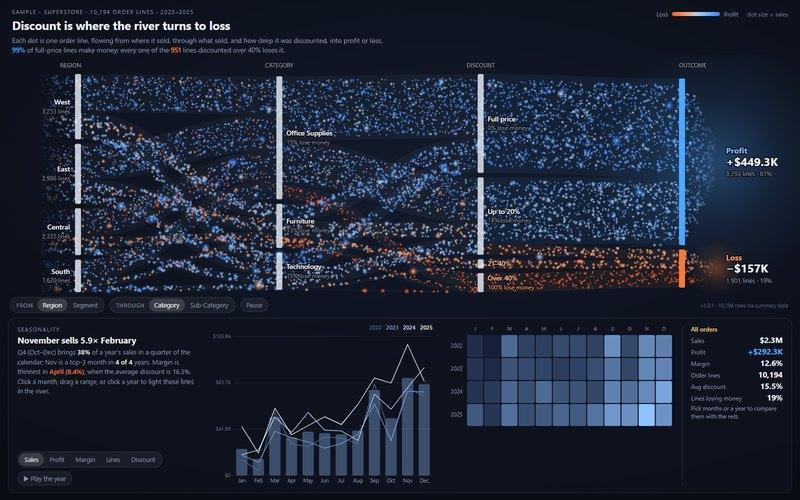
Every Superstore order line as a particle flowing from region through category and discount into profit or loss, with a linked seasonality panel: pick months or play the year.
Download .twbx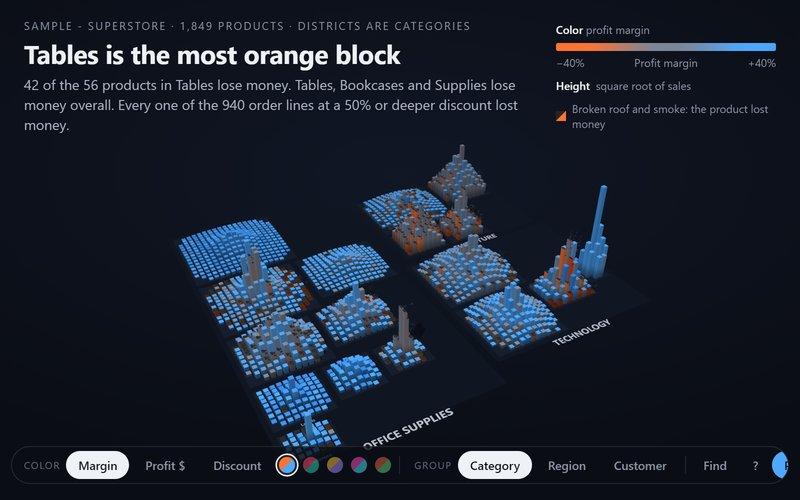
Superstore as a 3D city: one building per product, height from sales, color from profit. Loss-makers are cracked and smoking.
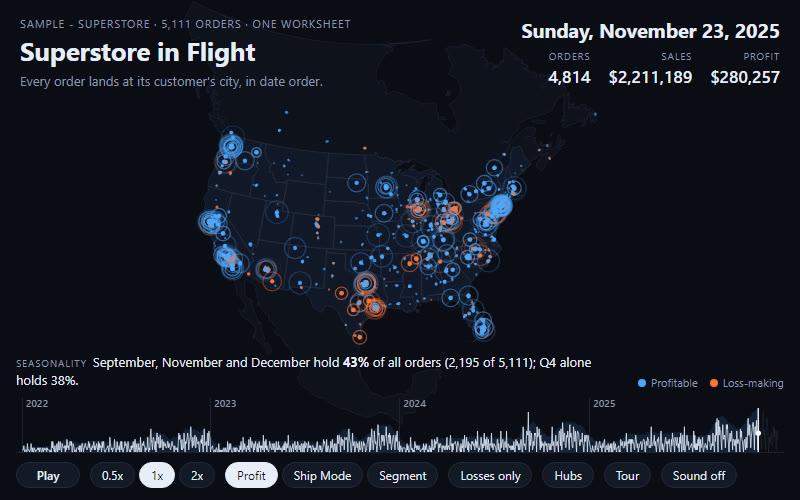
Four years of Superstore orders in 30 seconds: 5,111 arcs to customer cities in date order.
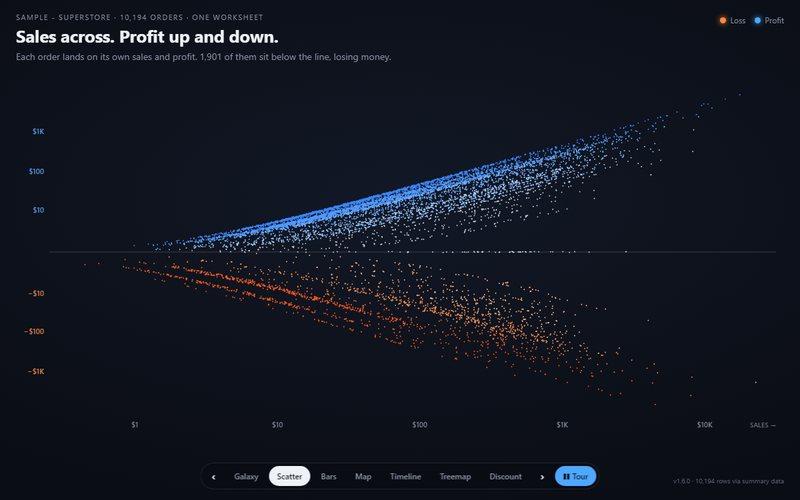
10,194 Superstore orders as particles, morphing between charts.
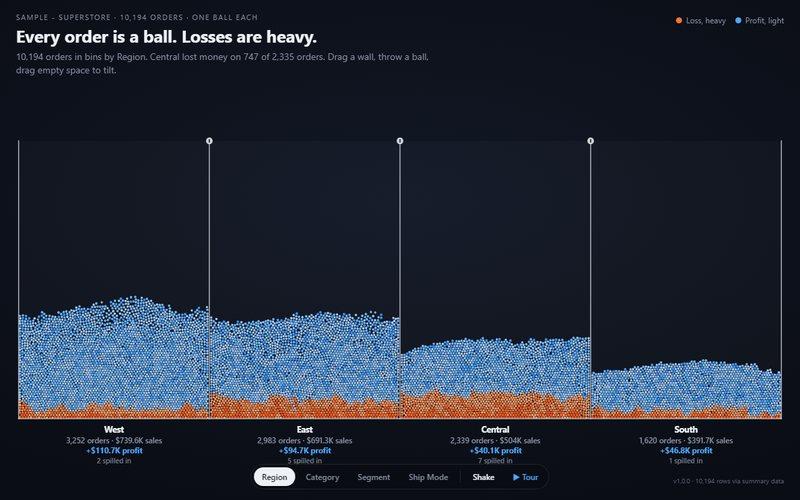
10,194 Superstore orders as balls in a physics sandbox. Losses are heavy and sink.
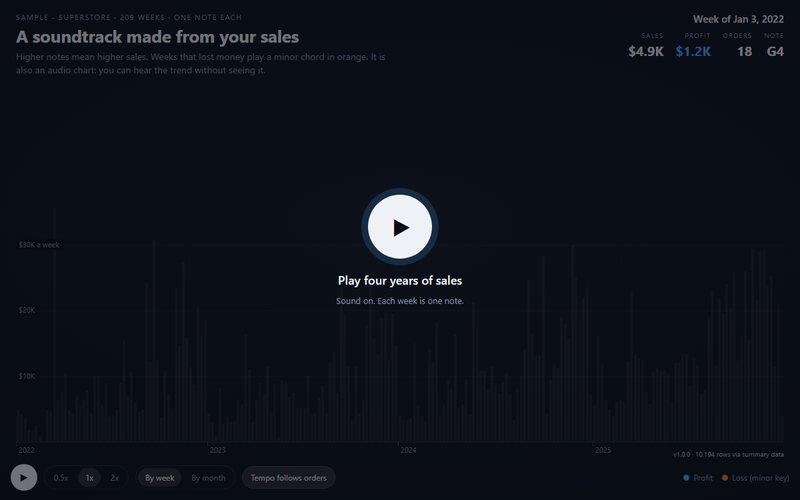
Four years of Superstore sales played as music, one note per week.
See how it works
SQL, storage, data apps and Tableau's MCP tools, drawn so you can watch them.
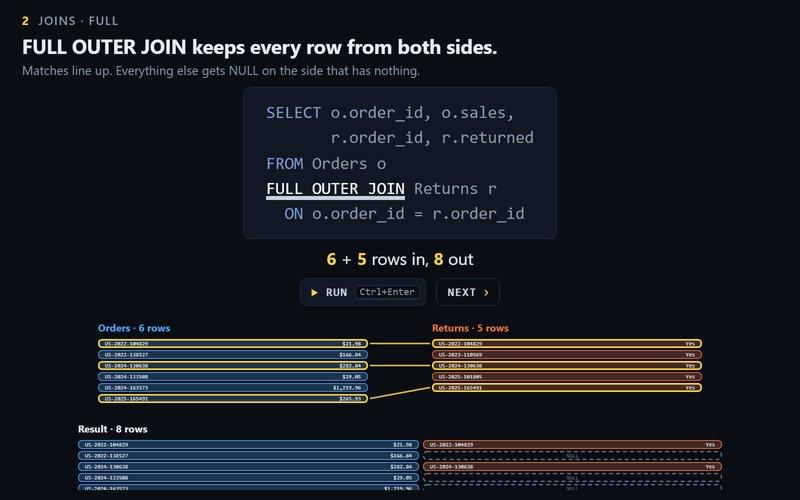
SQL you can watch: joins, row vs column storage, GROUP BY, indexes, NULLs and window functions, animated on real Superstore rows.
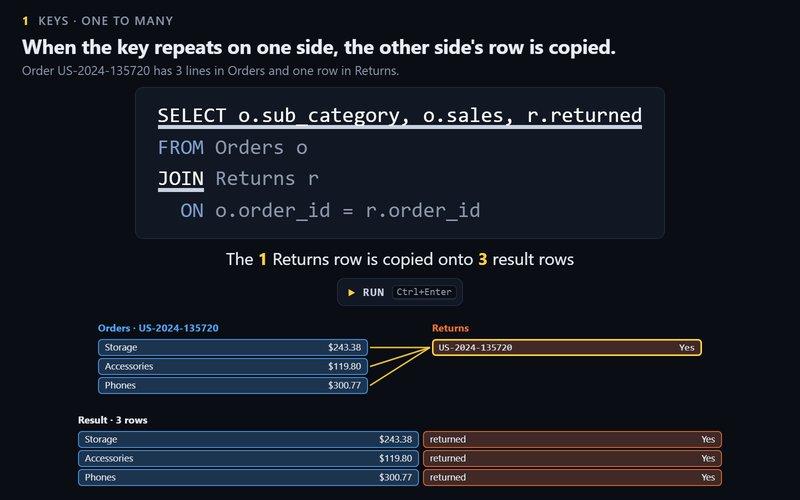
Keys, one-to-many copies, INNER to FULL OUTER, semi and anti joins, and why row counts change.
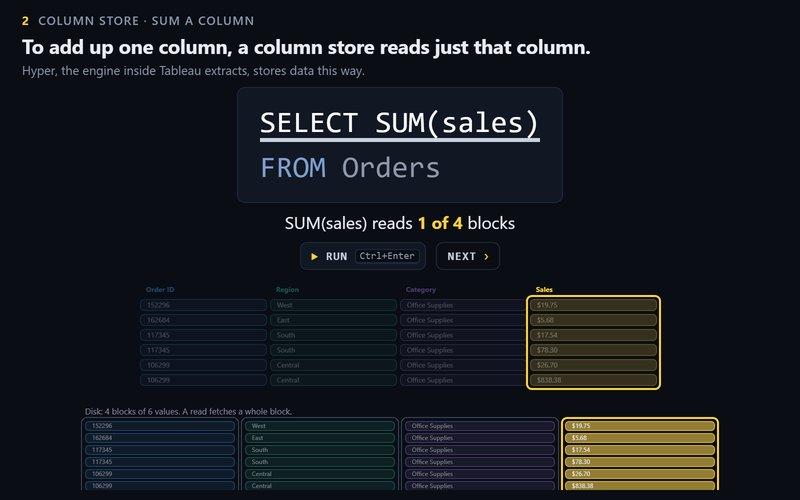
Row stores vs column stores: what each one reads for a sum, a lookup and an insert, and how columns compress.
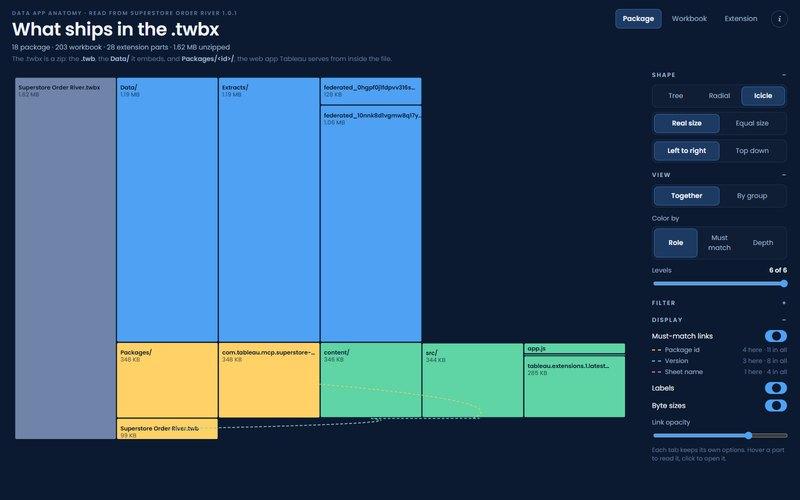
A short anatomy class on a real Tableau data app: what's inside the .twbx, the .twb and the .trex, the id, version and sheet name that must match across files, and what breaks when they don't. Then explore it yourself, sized by real bytes.
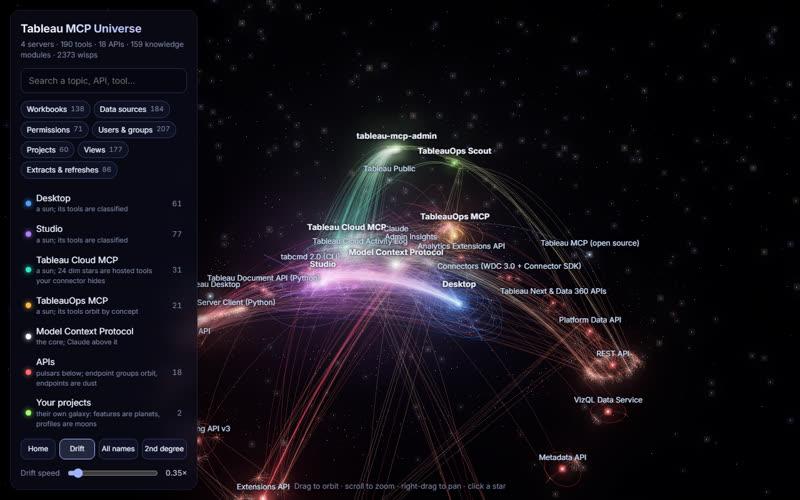
Every Tableau MCP tool, API and knowledge module as a 3D star map. Search a topic and see what can reach it.
Running, cars and other obsessions
My own runs and routes, two cars I love, balloons and test scores.
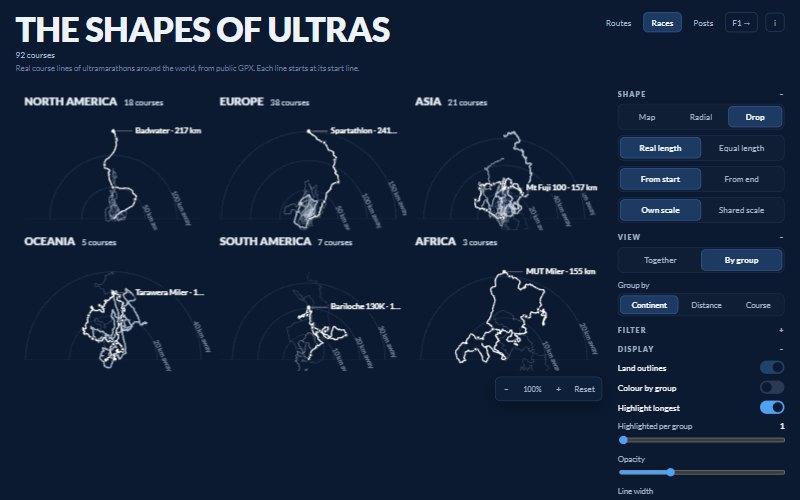
After The Shapes of Rivers: every line starts at one point, so only its shape is left to compare. 1,128 of my Garmin routes, 92 ultramarathon courses from public GPX, and 806 LinkedIn posts drawn as sentence turtles, by kind, region, year or distance, with longer lines drawn louder. Plus every Formula 1 circuit as a dashboard: outlines lapping, and every winner since 1950.
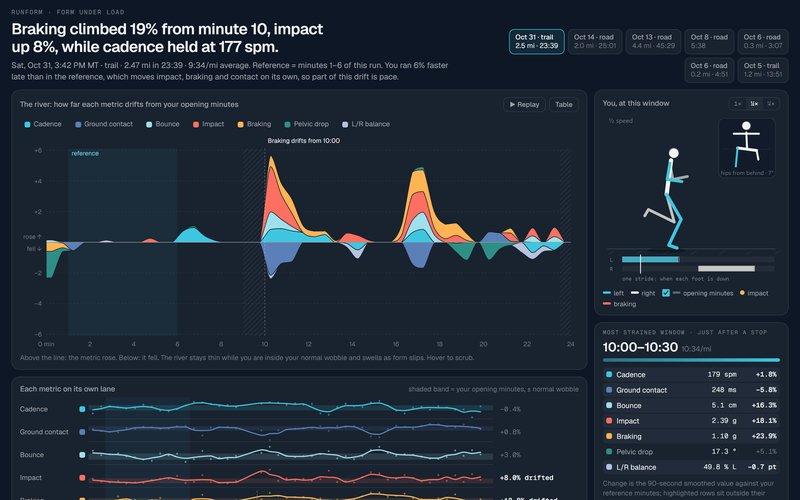
One run as a river, plus a runner drawn from the numbers as you scrub: every 30 seconds of cadence, ground contact, bounce, impact, braking, pelvic drop and left/right balance against that run's own opening minutes. Calm stretches stay a thin trickle; the river swells where form slips. Real waist-belt data from Runnur.
Download .twbx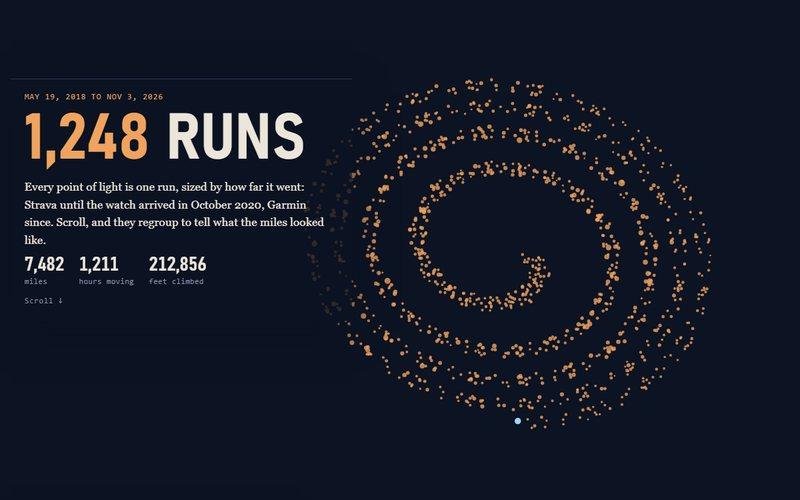
Every run since May 2018 as particles, one dot per run.
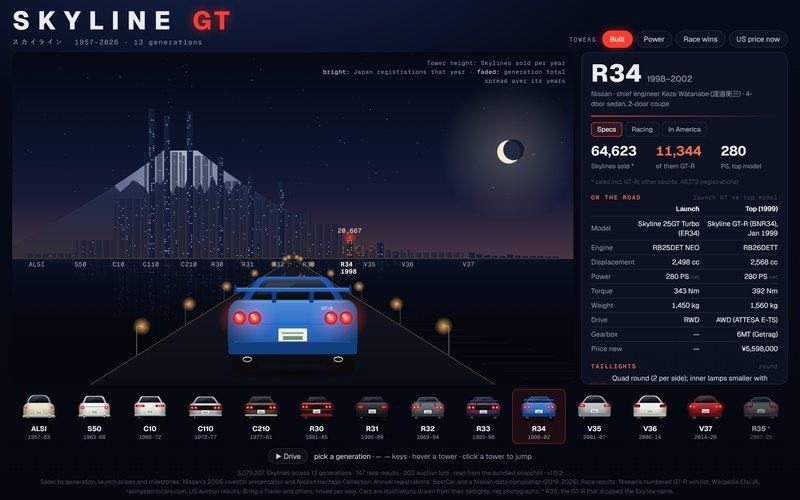
Thirteen generations of the Prince and Nissan Skyline as a night city by the bay: one tower per model year, sized by cars sold, power, race wins, or what they fetch at US auctions now that the 25-year rule lets them in. Each generation drives away from you with its taillights lit, round or not. Specs, the Hakosuka's disputed 50 wins, the R32's 29 for 29, and 203 sourced auction results.
Download .twbx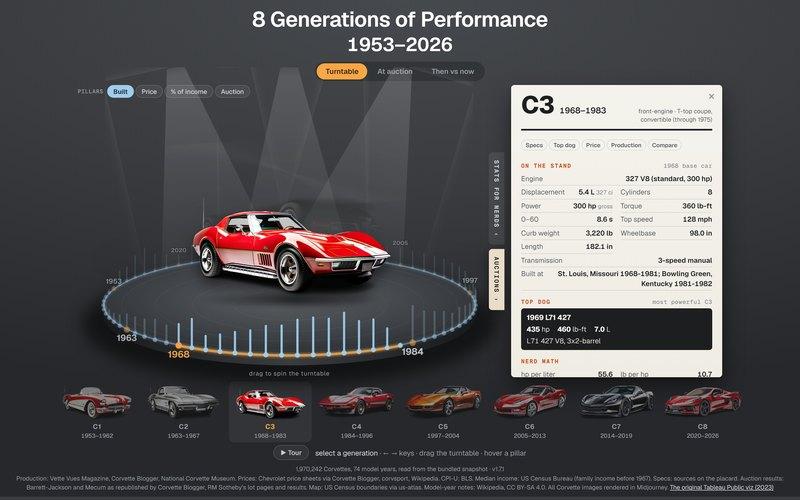
Seventy-four model years of Corvette, 1953 to 2026, on an auto-show turntable: one pillar per year, sized by cars built, price, or price as a share of household income. Spin it and each generation turns to face you, with a placard of stats for nerds: launch specs, the top dog, hp per liter, then-dollars or today's, and production. A rebuild of a 2023 Tableau Public viz, Midjourney cars and all.
Download .twbx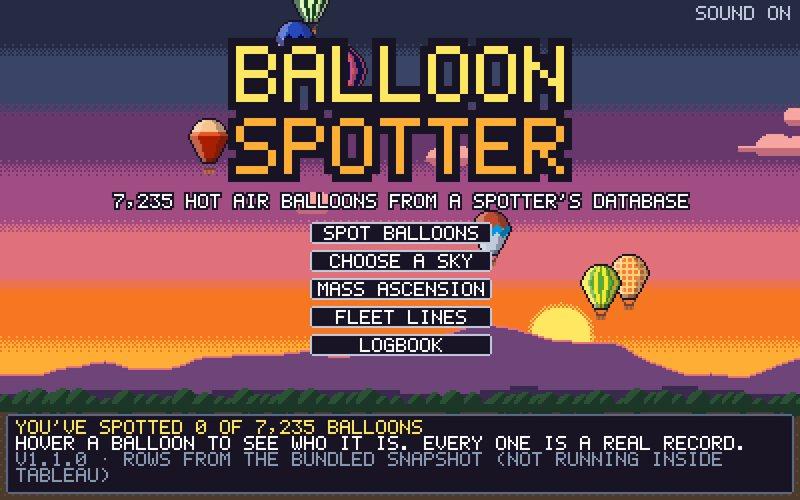
7,235 hot air balloons from a spotter's database. Explore by home, owner, maker, type or era, and keep a logbook.
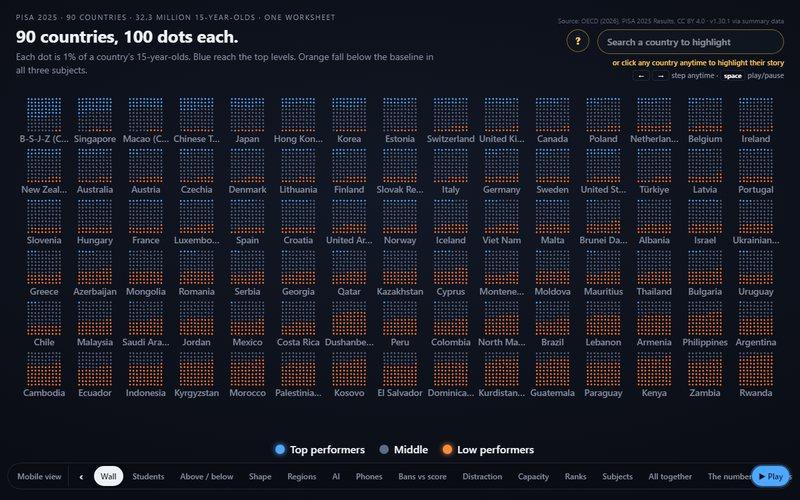
PISA 2025 as particles: 91 countries, 100 dots each. Data: OECD, CC BY 4.0.

84 countries from PISA 2025 as a scatter of weekly AI use against math score, then the same 84 dots spelling the correlation: r = −0.04. Data: OECD, CC BY 4.0.
Games and toys
Still Superstore underneath.
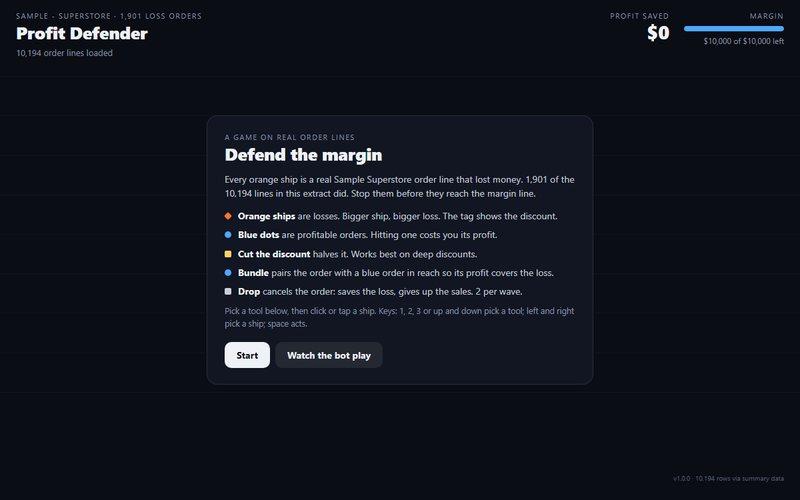
An arcade game on real Superstore order lines: stop the loss-making orders before they reach the margin line.
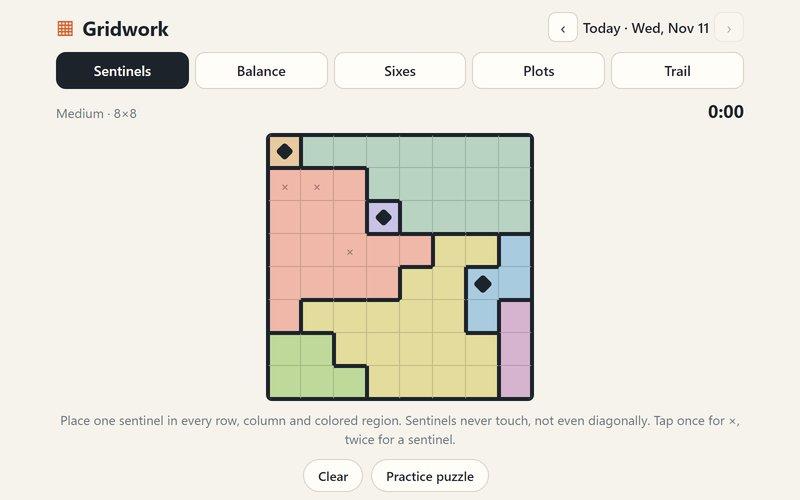
Five daily logic puzzles. Each day's seeds live in a Tableau data source, and every puzzle has exactly one solution.
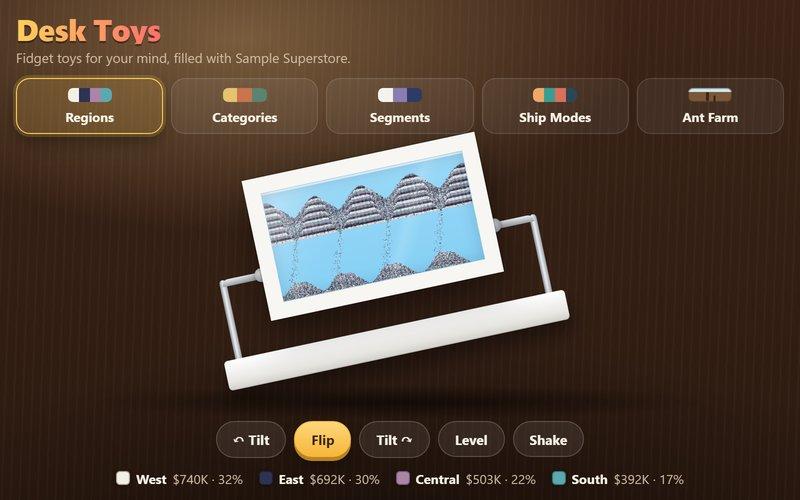
Moving sand pictures you tilt, flip and shake, layered by Sample Superstore sales, plus an ant farm with one ant per sub-category.
Want one of these on your own data?
What a data app is, how to build one with Claude, and the 7 day dashboard rebuild.