

// Build Log · Tableau Bridge · Scout
Tableau Bridge Stopped Refreshing and Nothing Showed as Failed
The Friday before Labor Day, Bridge stopped refreshing a 600+ user environment and Tableau showed no failures. The timeline from the job log, why a Bridge outage hides, the fix, and what I can and cannot prove.
NOV 19, 2026
The Friday before Labor Day, Tableau Bridge stopped refreshing data in a 600+ user environment. Nothing in Tableau showed as failed. This is the timeline from the job log, what the fix was, and what I can and cannot prove about it.
What happened
Every time below comes from the job log. All of them are Mountain Time, Friday, September 4.
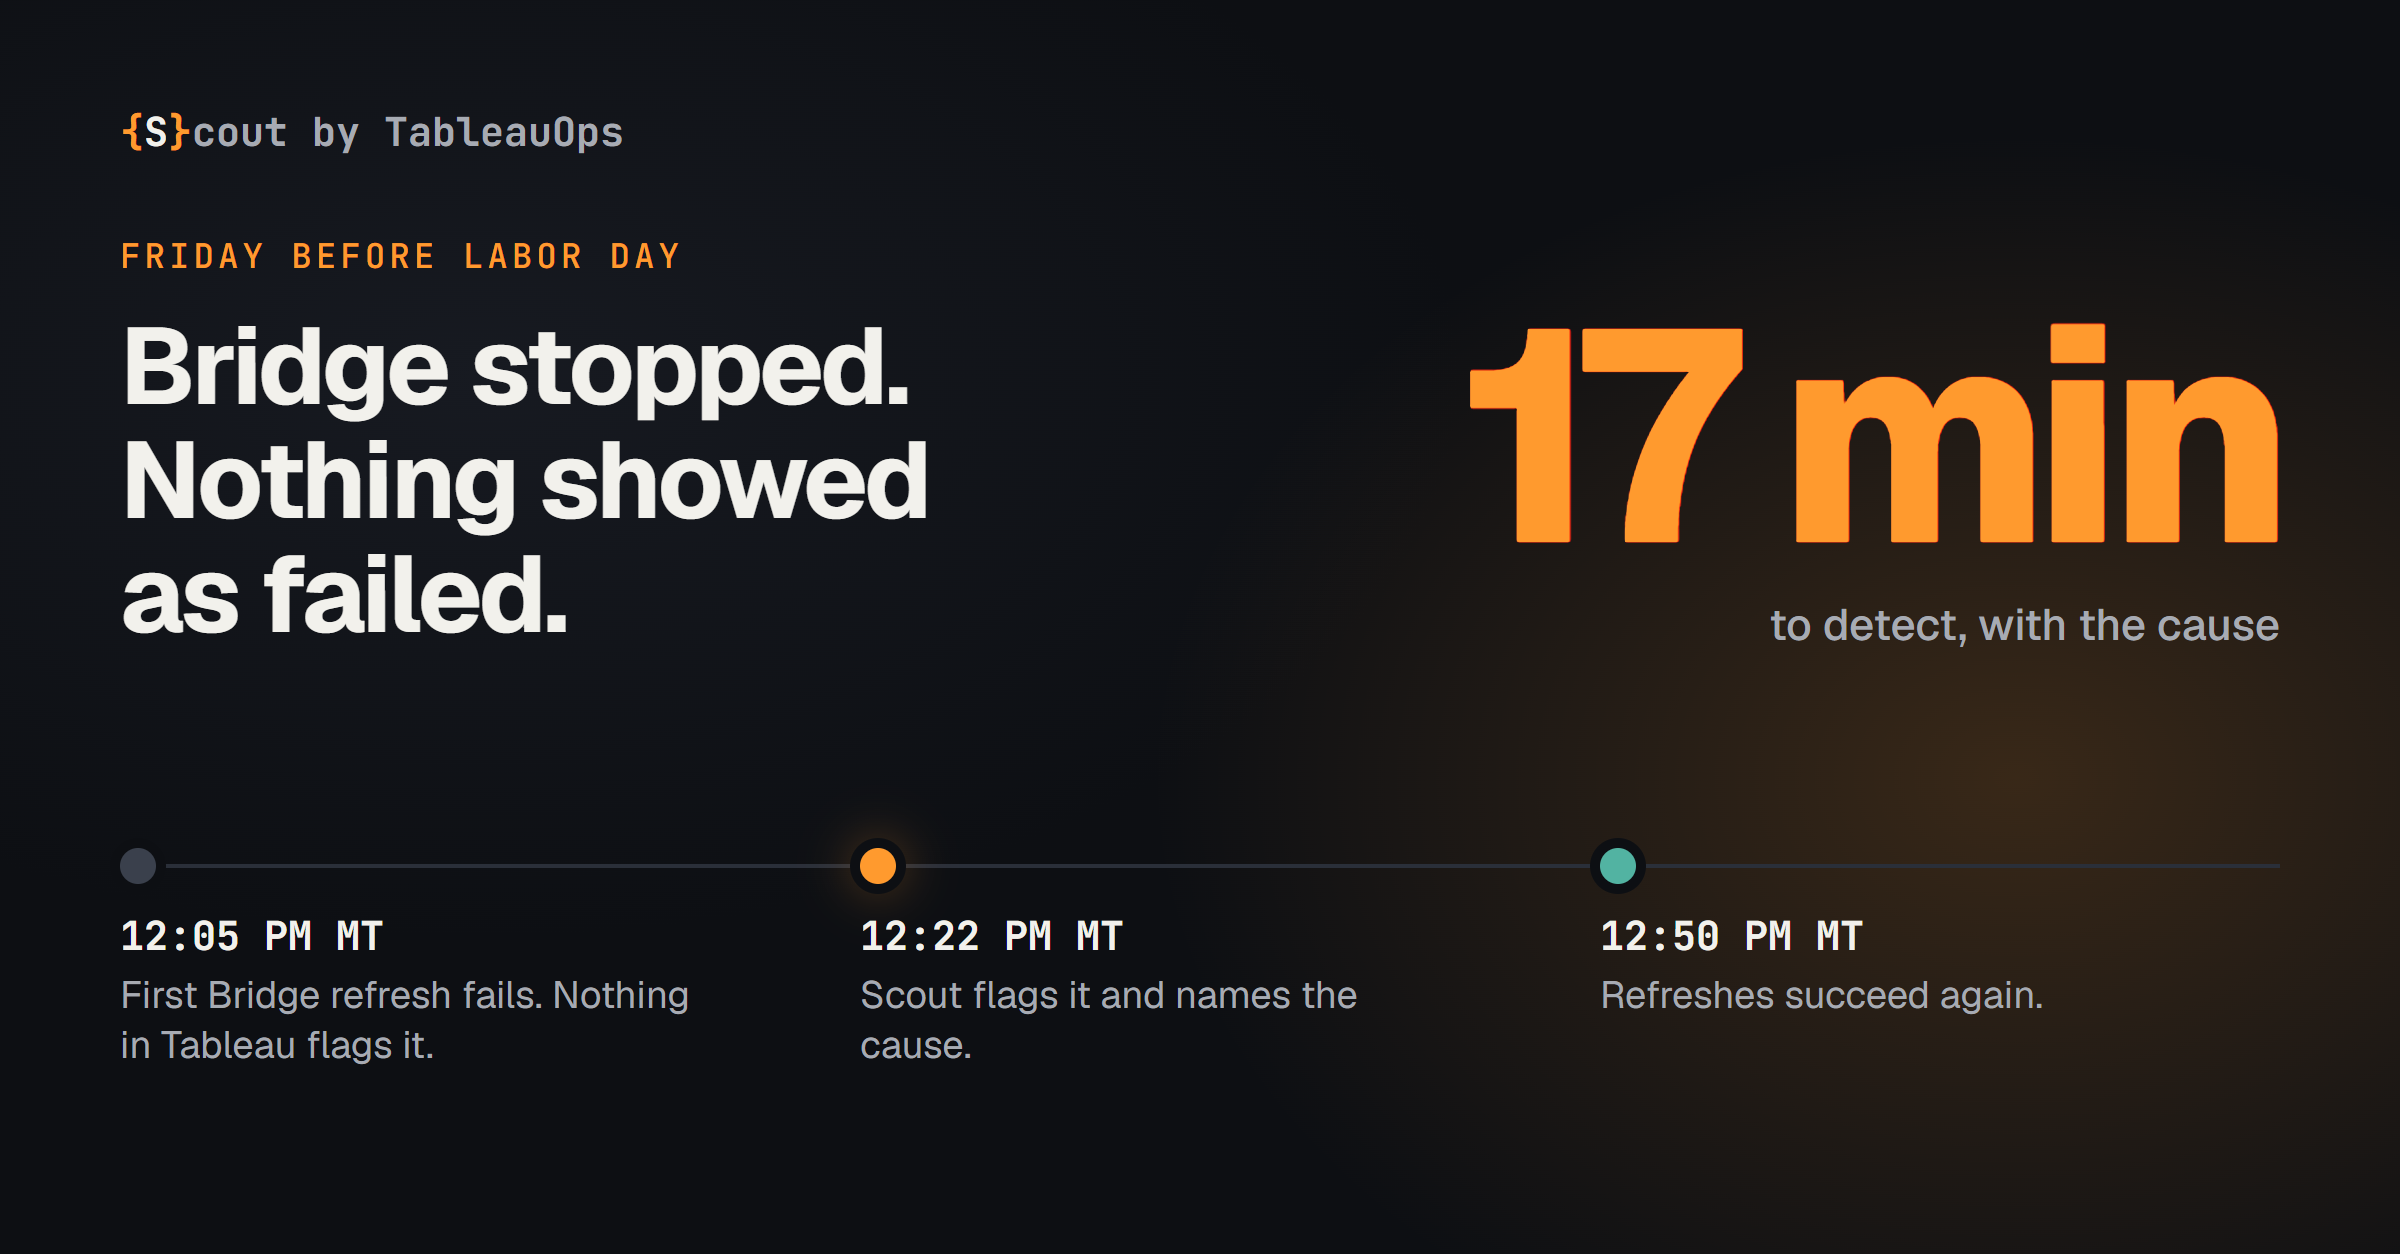
- 12:05 PM. The first Bridge refresh job fails. Nothing in Tableau flags it.
- 12:22 PM. Scout opens a Bridge down incident. The note on it reads: "21 of 64 dispatch jobs failed in the last 1h (33%)."
- 12:30 PM to 12:45 PM. Every Bridge job fails. Not one succeeds.
- 12:45 PM. The last failure. 51 failed jobs in total.
- 12:50 PM. The first refresh succeeds again.
That is 17 minutes from the first failure to the incident, 28 minutes from the incident to healthy, and 45 minutes end to end.
Why nothing showed as failed
This is the part that took me a while to understand.
When Bridge is down, the job that fails is the one that hands the work to Bridge. The extract refresh itself never starts. A refresh that never ran has not failed. So the data source does not show a failed refresh. It shows the last good one.
Scout said the same thing in the incident. The real extract refreshes never ran, so they would not show as failed on the data source cards.
If you watch for failed refreshes, a Bridge outage looks like a quiet afternoon. The dashboards open. The numbers are there. They are old, and nothing on the screen says so.
What Scout looked at instead
Scout was not watching the data sources for this one. It was watching the jobs that dispatch work to Bridge. 21 of the last 64 had failed, which is 33 percent in one hour, and that was enough to open the incident and name the cause: Bridge is not dispatching.
Naming the cause is what saved the time. "A refresh failed" sends you to the data source. "Bridge is not dispatching" sends you to the Bridge machines.
The fix
The Bridge connection had failed. I restarted two Bridge VMs and signed back in to the Bridge service. The last failure was at 12:45 PM and the first success was at 12:50 PM.
It was not a clever fix. It rarely is. The hard part of an outage like this is knowing it is happening, and knowing where to look.
What I can and cannot prove
I retracted a story like this once. I had quoted a detection time from a diagnosis string, and when I checked the raw log the real number was hours worse. So here is where the line sits on this one.
From the log: every time in the timeline above, the 51 failures, and the text of the incident.
My account, not data: that this was fixed before the infrastructure team or a single client noticed. Nobody reported it, and nobody has mentioned it since. That is not the same as proof.
Could be better: 17 minutes. The incident opened once a third of the jobs in the hour had failed. I would like that to be faster without paging people for one bad job.
What to check on your own site
You do not need Scout to look for this.
- Find the jobs that send refreshes to Bridge, not only the extract refresh jobs. On this site they were named
refresh_extracts_via_bridge. - Look at their failure rate over the last hour, not at whether any single data source says failed.
- Compare the last successful refresh time on a Bridge data source to its schedule. A data source that says "succeeded" six hours ago on an hourly schedule is the tell.
If you would like that checked for you, the free Scout site review is read-only and takes about five minutes.